Google deprecated its Maps JavaScript API HeatmapLayer with no migration path, a reminder of what it costs to build on a platform where features disappear at the vendor's discretion. MapLibre GL JS offers native, more capable heatmap rendering that isn't subject to anyone's product roadmap. With Stadia Maps tiles, the migration is often simpler than it looks.
In May 2025, Google deprecated the Heatmap Layer in the Maps JavaScript API. One year later, it was gone. If you built something on google.maps.visualization.HeatmapLayer it broke without warning, without a migration path, and without much explanation beyond "low customer usage."
That's the cost of building on someone else's infrastructure when that someone is Google. Features disappear when they stop serving ad revenue. Pricing changes when they decide it should. And when it breaks, you're filing a support ticket into a void.
What Actually Broke
The Heatmap Layer was part of the visualization library: an overlay that rendered geographic density from an array of data points. Devs widely used it for visualizing foot traffic, delivery density, sensor data, event activity, and dozens of other real-world use cases. Teams built on it in good faith, and now those same teams are scrambling to find a replacement before their users notice.
What One Customer Did About It
We recently helped a former Google Maps customer through exactly this situation. They'd been using Google Maps, including the Heatmap Layer, as the foundation of a core product feature. When the deprecation hit, they didn't just need a heatmap replacement; they needed to decide whether to keep rebuilding on a platform that had just shown it was willing to pull the rug from underneath them.
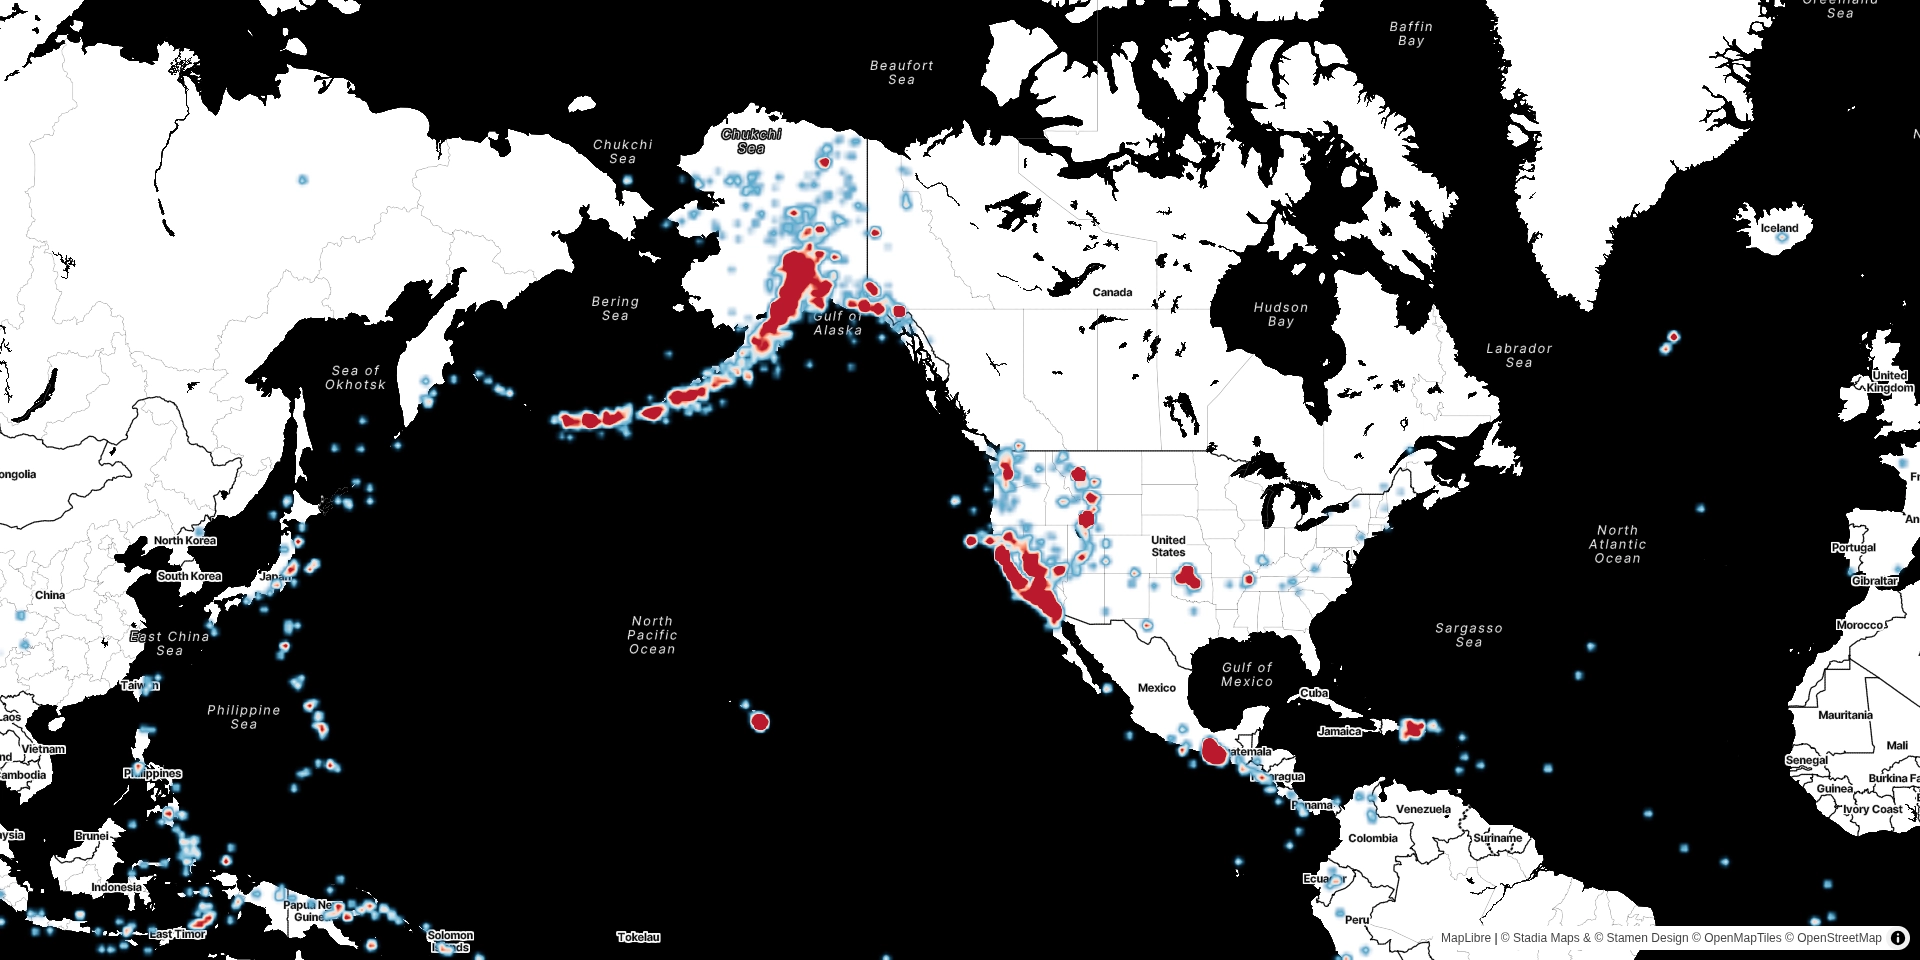
They're now migrating to MapLibre GL JS with Stadia Maps tiles. The heatmap layer in MapLibre is built in, more capable than what Google offered, and not going away on a whim. The migration is going smoothly, and they'll end up with greater control over their visualizations and a bit of peace of mind.
Why MapLibre GL JS?
MapLibre GL JS is open source, actively maintained, and used at scale by teams that can't afford to bet on a vendor's continued interest. It has native heatmap rendering: zoom-responsive, data-driven, and fully configurable. You're not working around a limited API; you're working with a proper layer type.
Equally important: It's not tied to any single tile provider. You control where your map data comes from. Stadia Maps is an active contributor to MapLibre, and we designed our interactive basemaps to work with it out of the box.
Why Stadia Maps?
We provide the basemap tiles that render underneath your data. Fast, globally distributed, and built to work with MapLibre without configuration gymnastics.
We're also not Google. We don't track your users. Our pricing is transparent and doesn't change because we decided to restructure a product line. When something breaks, you talk to a human, not a ticket bot.
If you're already planning a move away from Google Maps, we have a dedicated migration guide that covers maps, routing, and geocoding. The heatmap is usually the least complicated part of the switch.
And if you have questions about your specific setup, reach out. Real human support is one of the things we actually mean when we say it.